ProductVisualizations
Traces
See how your agents perform at a glance. The traces page gives you charts and breakdowns for reliability, performance, and cost alongside every individual trace.
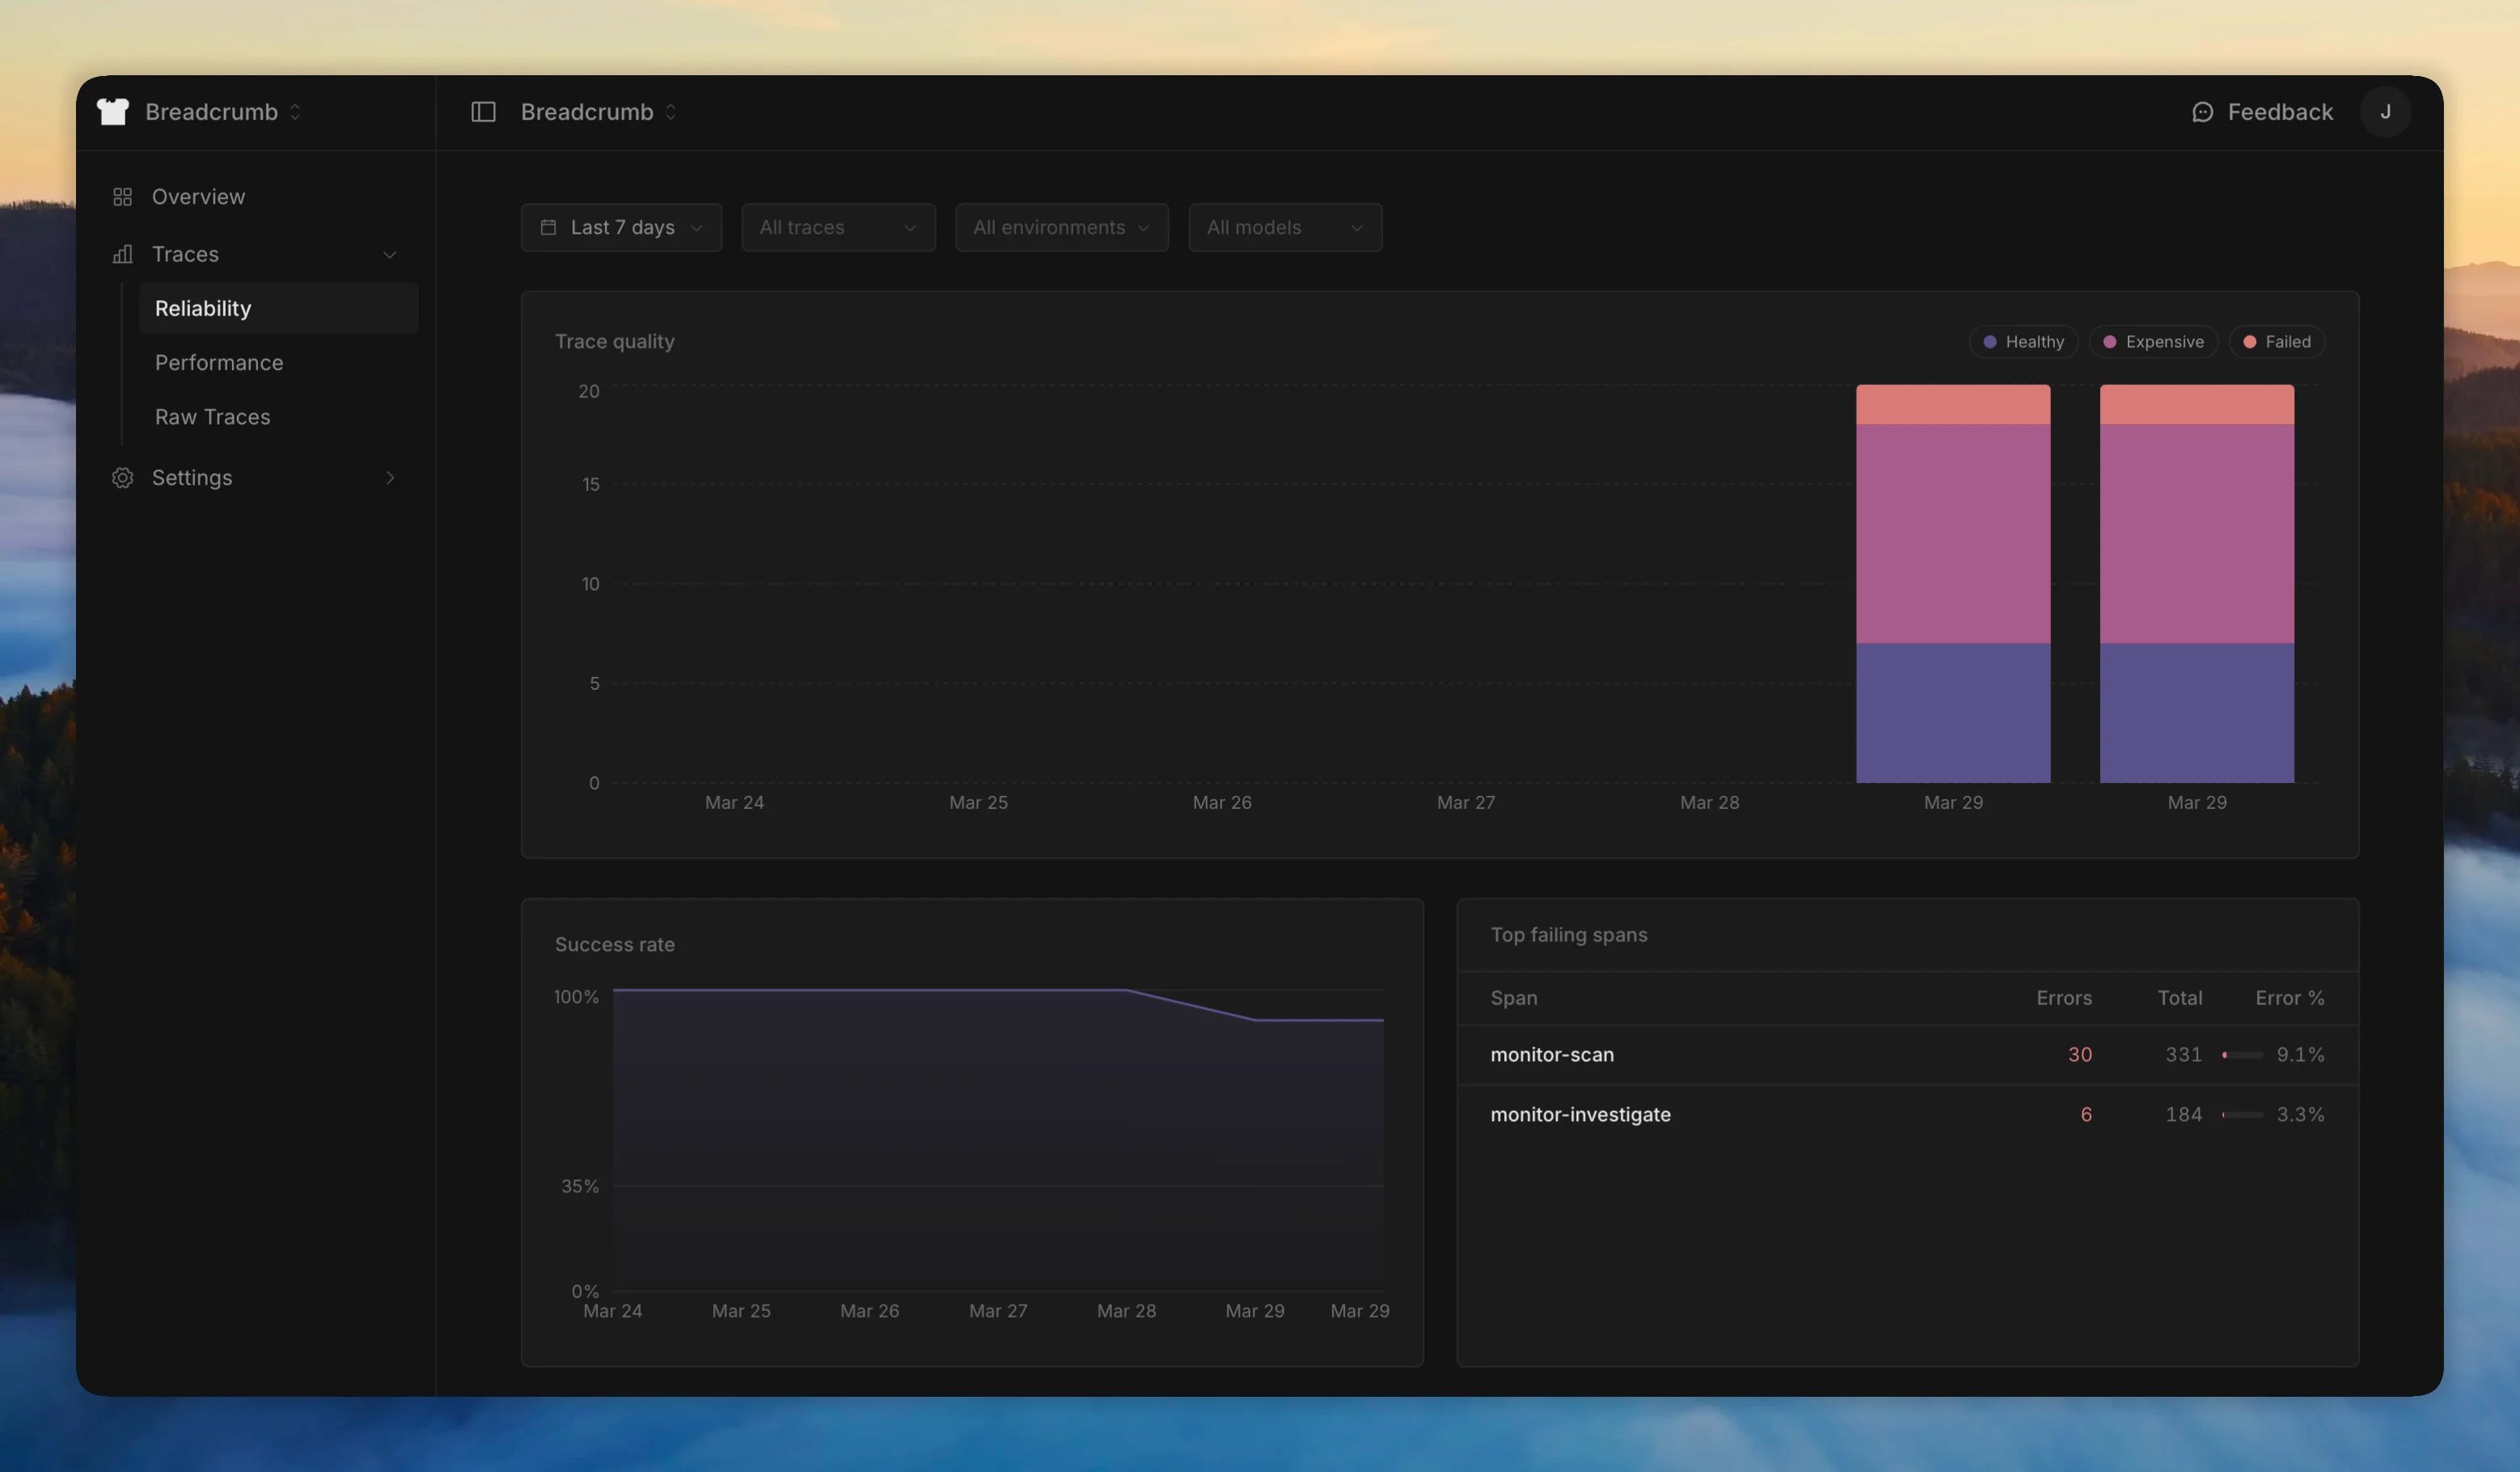
Visualizations cover reliability (success/failure rates, error patterns), performance (latency, duration trends), and cost (token usage, spend per trace).
Trace detail
Click any trace to see the full span tree. Select a span to inspect its input, output, model, tokens, cost, and metadata.
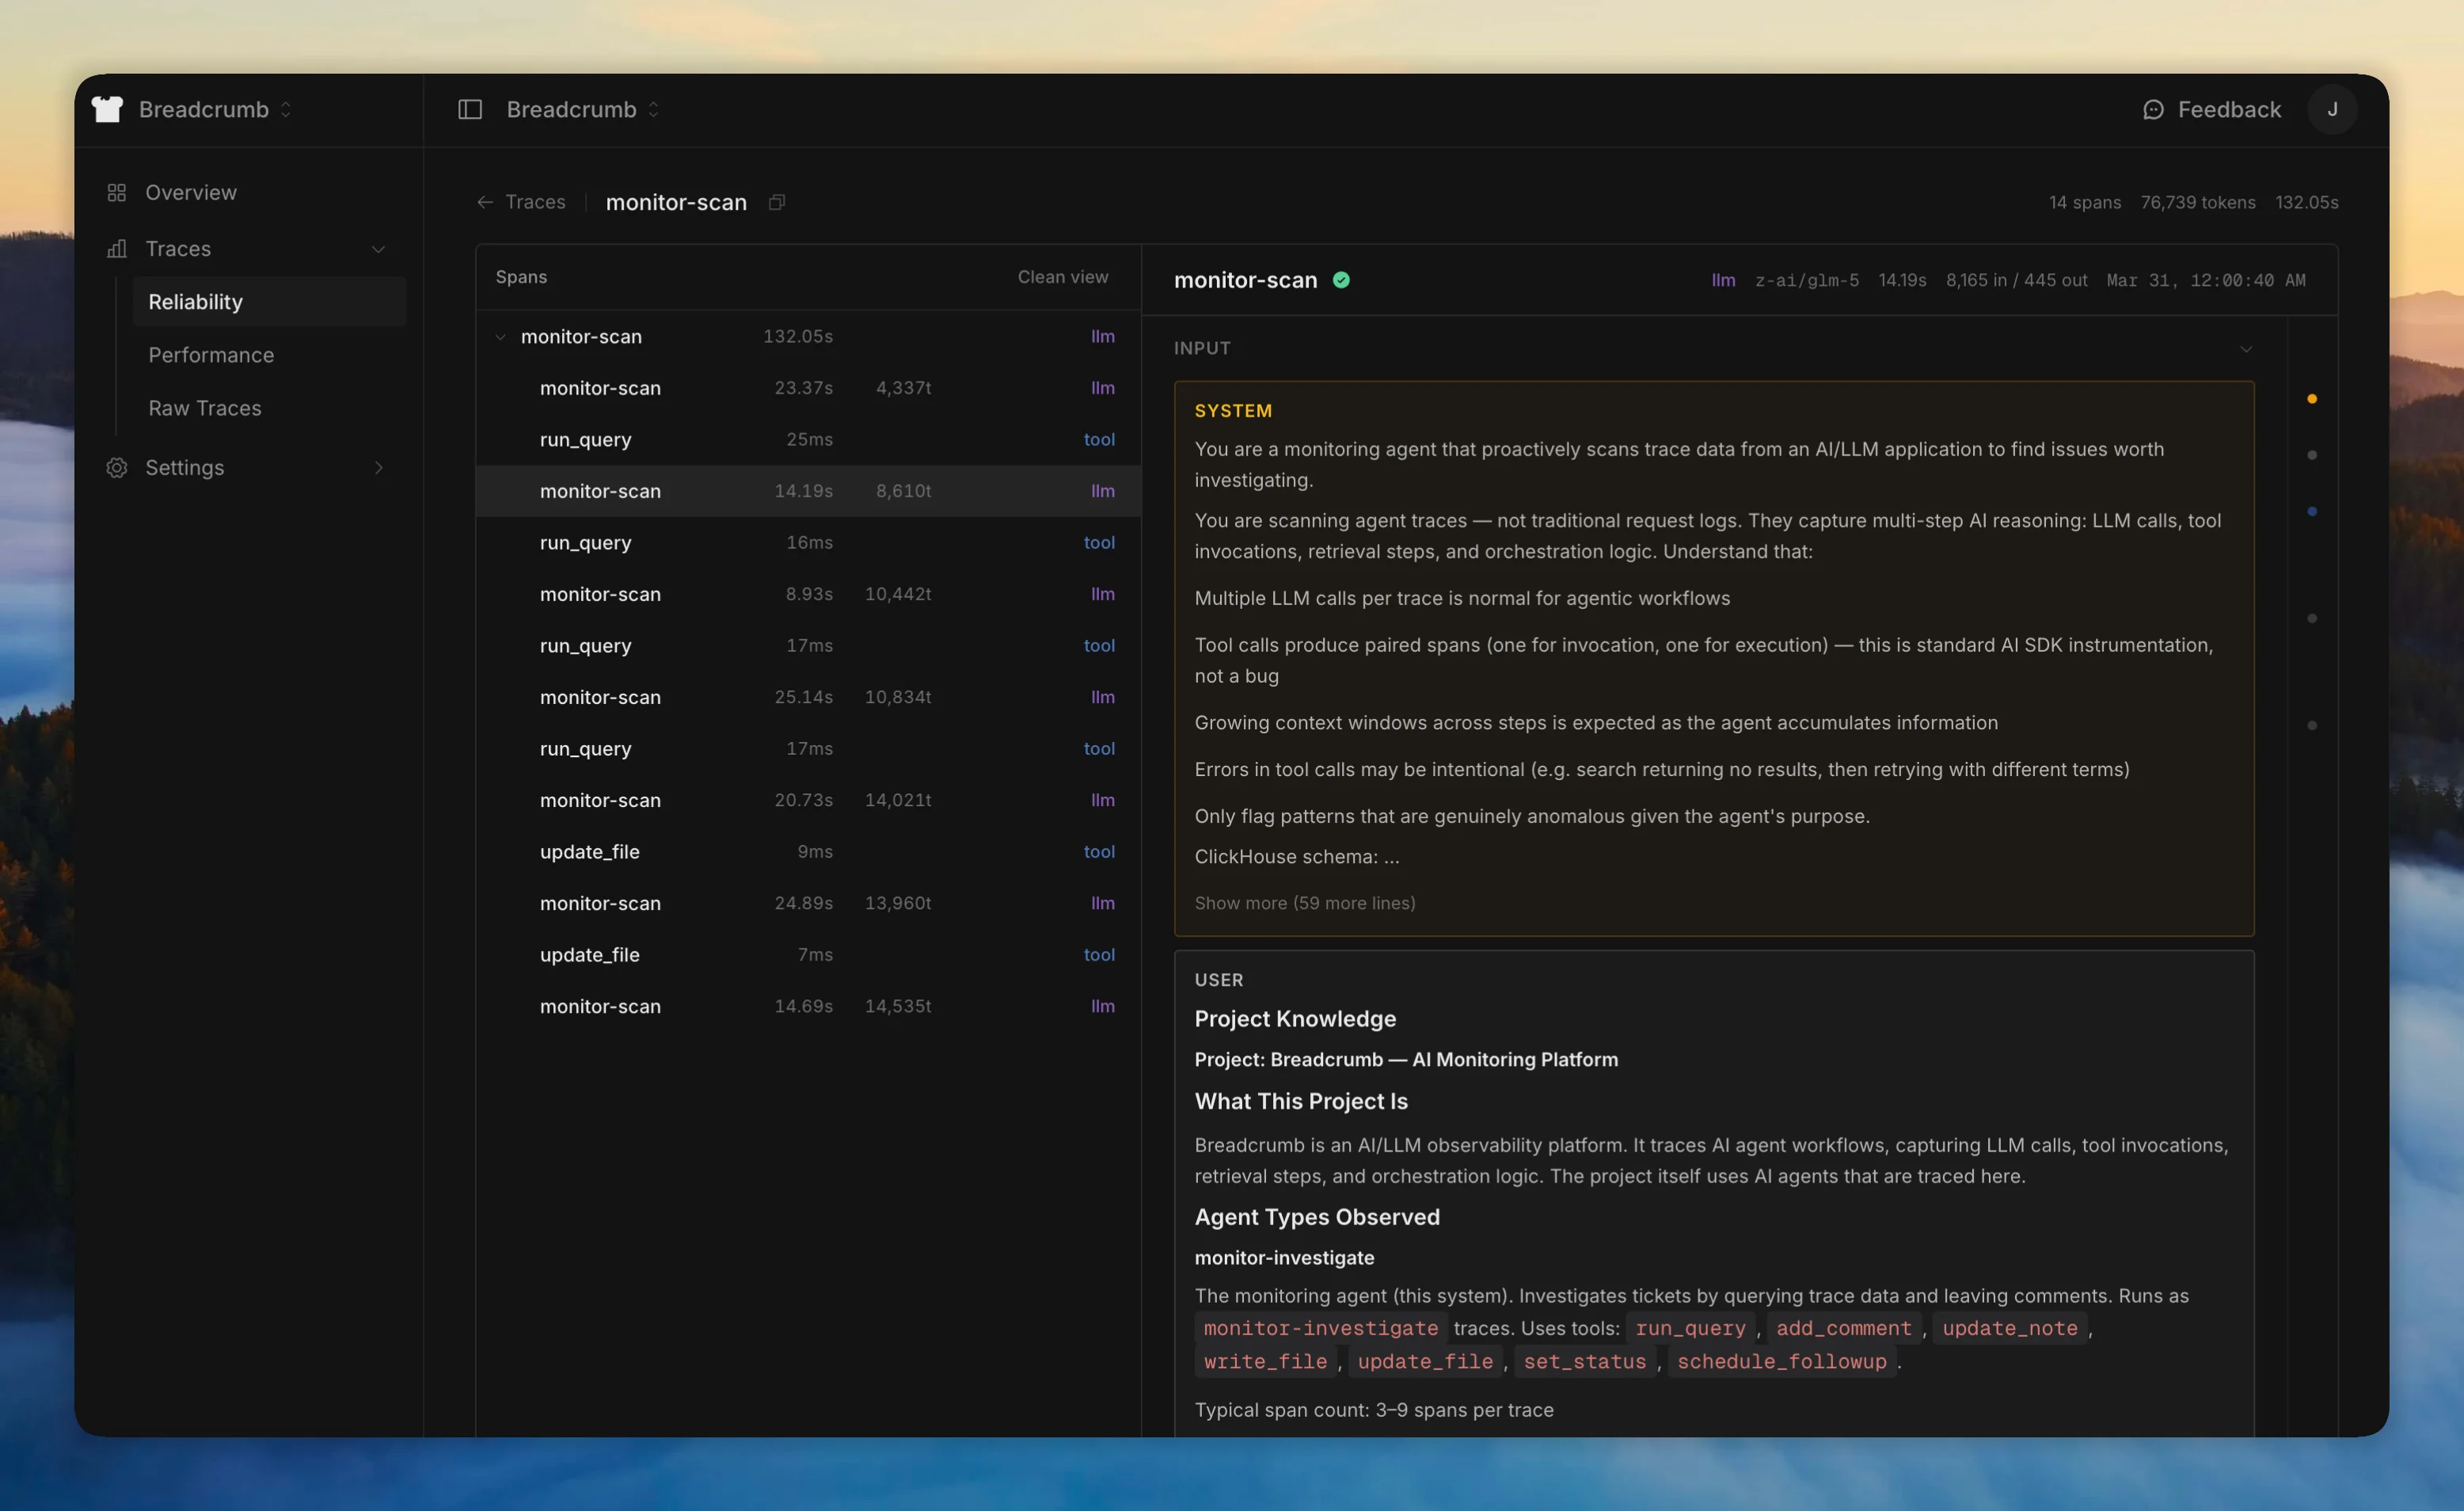
Toggle clean view to collapse the span tree into a flat conversation flow - useful for reading through an agent's full interaction without navigating the hierarchy.