ProductVisualizations
Dashboard
The project overview shows key metrics (traces, cost, duration, error rate) with period-over-period changes, followed by the monitor kanban board.
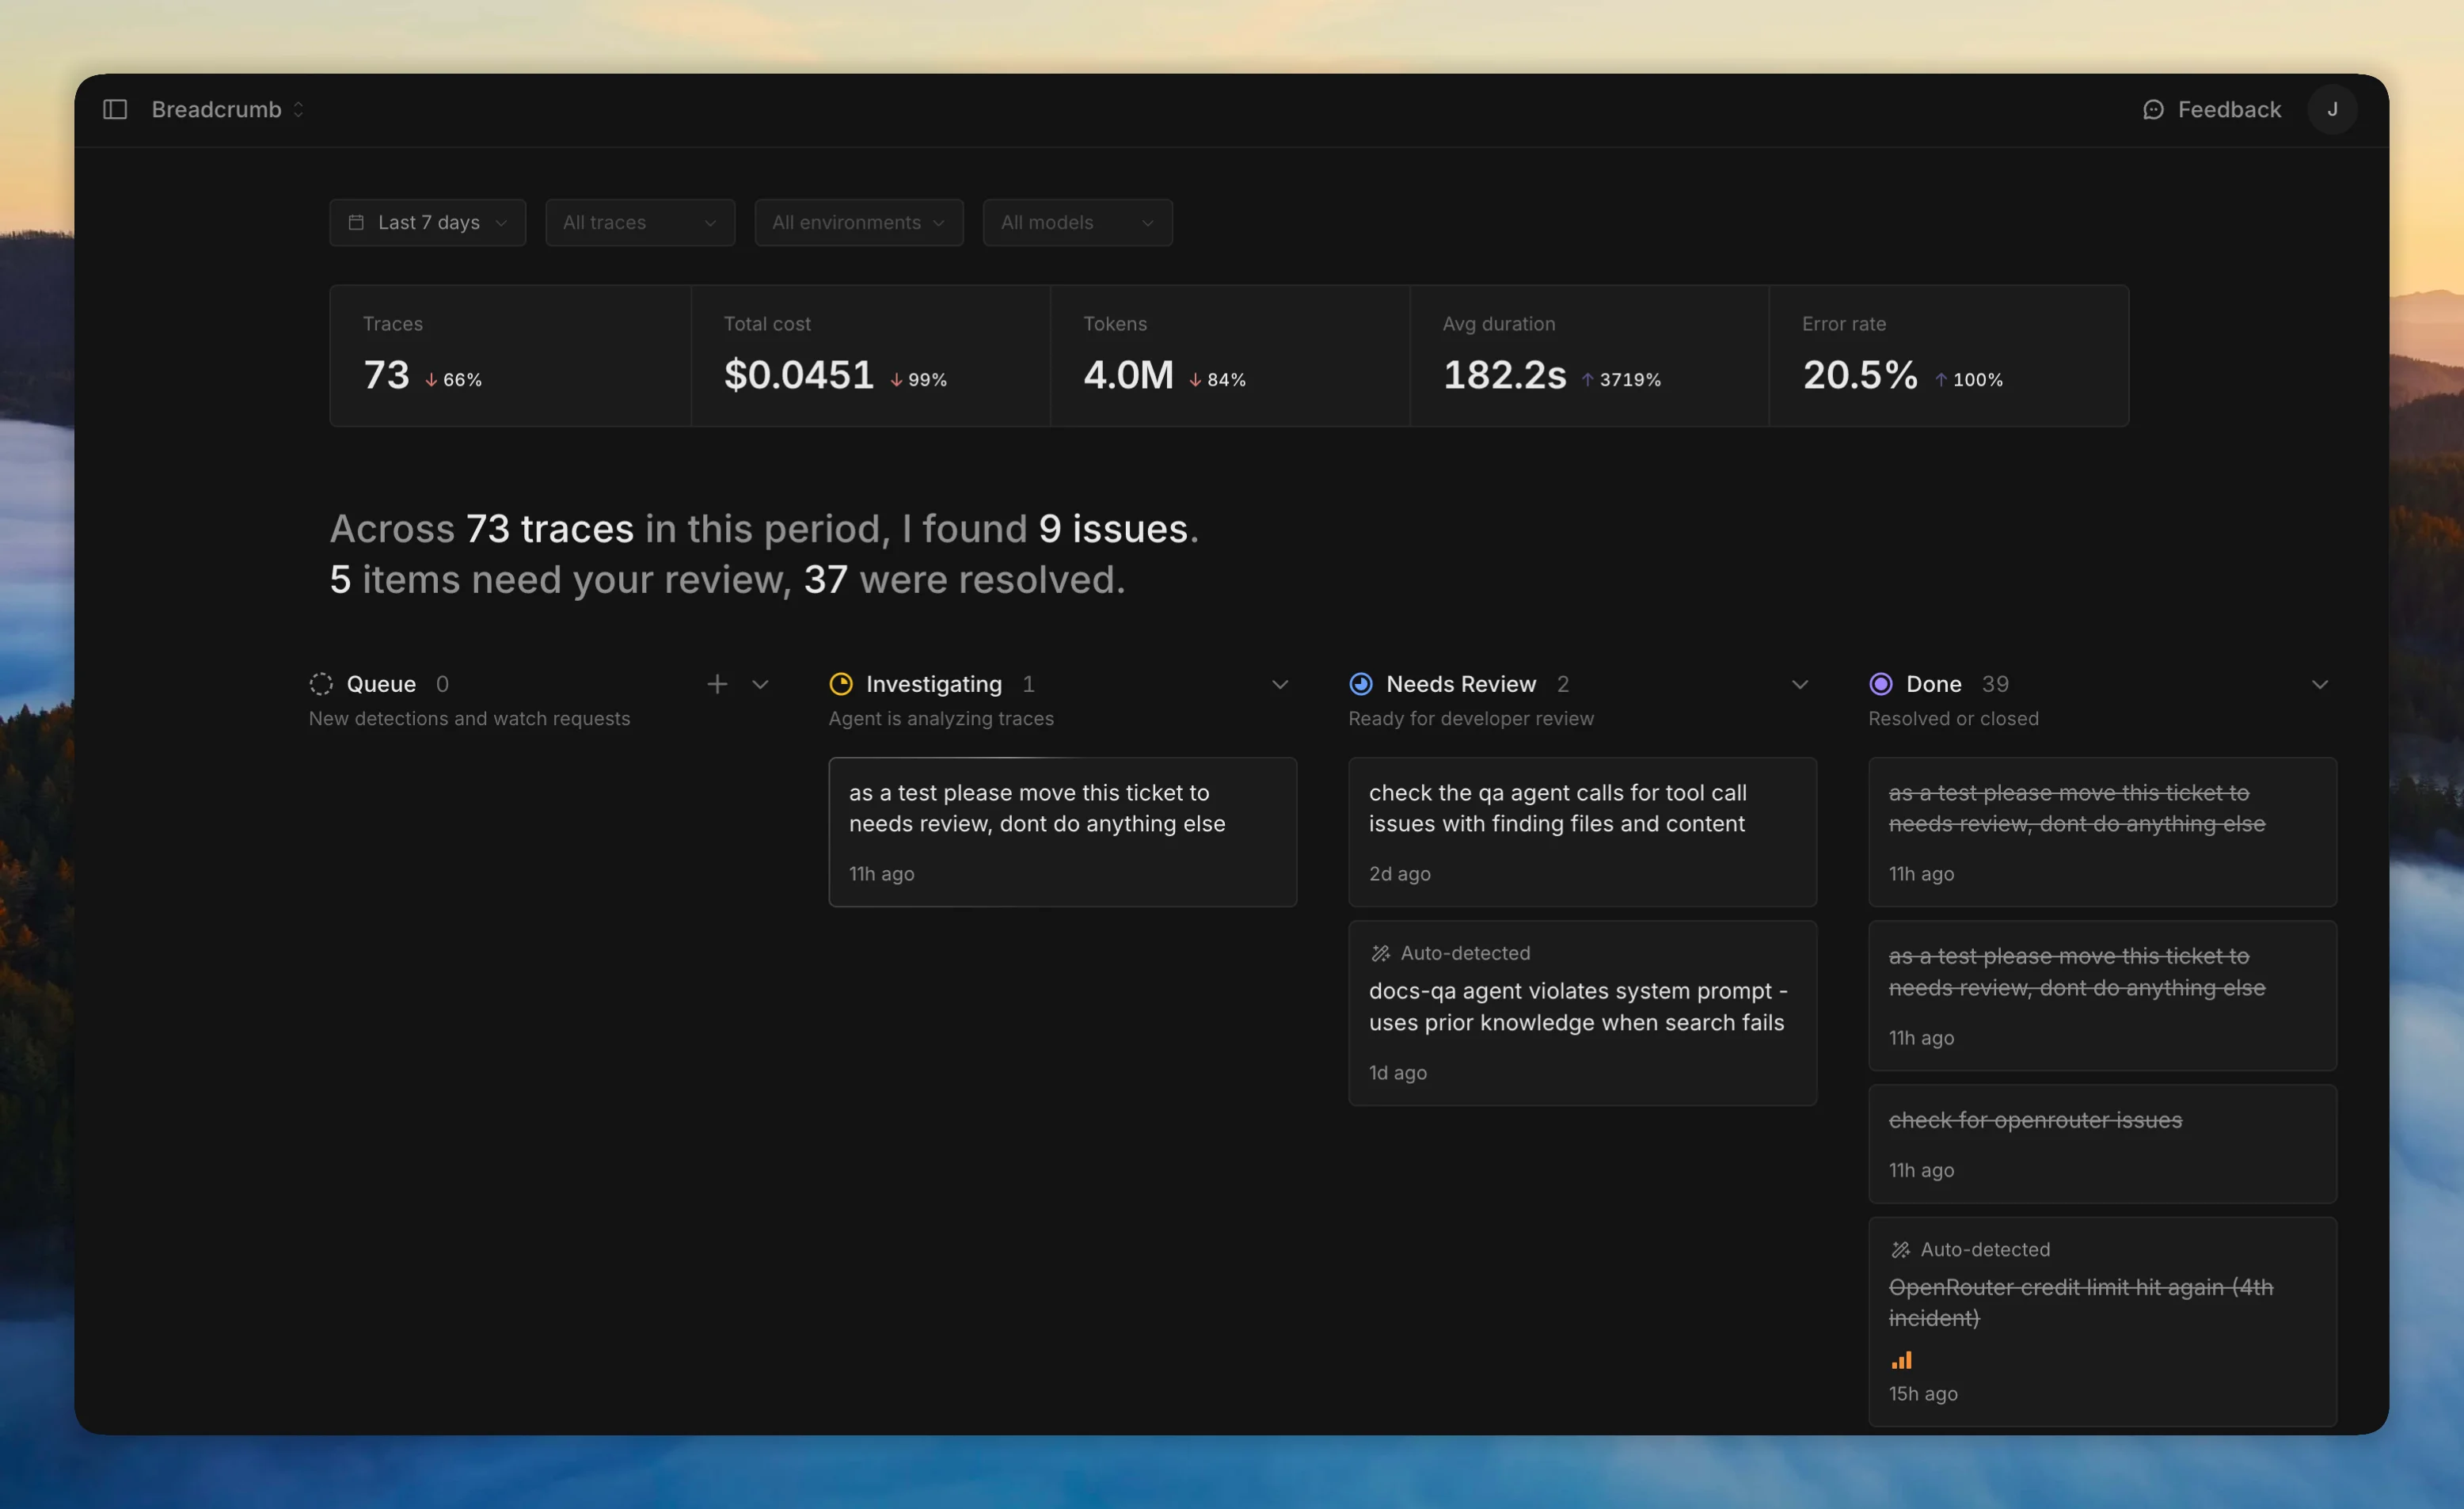
Filter by date range, trace name, environment, and model.
The project overview shows key metrics (traces, cost, duration, error rate) with period-over-period changes, followed by the monitor kanban board.
Filter by date range, trace name, environment, and model.